eBook – 9 Harmonic Patterns For Everyday Profits
Cracking The Code Of Price Action With Harmonic Patterns

It was a perfect Hawaiian Sunday morning. Not a cloud in the sky and not a worry to be had.
That is, until 7:48 a.m. local time when all hell broke loose. In an instant lives would be lost, a powerful fleet would be crippled and the course of an entire nation would be changed forever.
The toll at the end of the day? Nothing short of catastrophic. All eight U.S. battleships were damaged, and four of them were sunk. One hundred eighty-eight aircraft were destroyed. And a devastating loss of 2,403 Americans were killed with an additional 1,178 wounded.
This truly infamous date and the future of a country turned in large part thanks to the heroic work of a small unknown group within the U.S. military.
Codebreakers.
These men and women successfully decoded the messages, locations and missions of the Japanese navy — leading to a successful comeback. At the core of their work? Identifying patterns and actually getting inside the expansive intelligence system of the Japanese government.
Every day, successful traders decode the true intentions of price action within every market. Although the stakes are far from life or death, the financial outcome leads to the creation of wealth on a scale that we’ve never seen before.
That’s right. War-like fortunes are being made — simply by decoding price action.
The key to decoding this ‘fortune-making price action’? It’s as old as time.
It surrounds everything you touch, see and do.
We’re talking about Fibonacci ratios and the natural, recurring patterns they identify within every market around the world. Pretty much without fail.
If you’re like 99% of amateur traders wading into the market, you know about Fibonacci and perhaps you use it to guide your entries and exits. Odds are very good however, that you are just scratching the surface enough to create more risk than actual gain with your trading.
It’s not that you’re doing anything wrong. In fact, you’re probably applying the strategies that you’ve learned perfectly.
Perfectly wrong that is. Why?
Because the Fibonacci strategies that work for stocks and options really have no place with futures. Especially if you’re a daytrader.
Make no mistake, the opportunities are there for the taking. Within every session, there is an invading force of price action that’s unmistakably tied to Fibonacci reversal and retracement levels.
Cracking the code and accurately being able to see this price action? That requires a completely different view of the market (and your chart) than what you’ve seen or even used before.
Chapter 1:
The Invisible Invading Force Of Fibonacci
Unlock the massive profit potential from Fibonacci retracements and reversals
The signs of an impending attack on Pearl Harbor were all present — yet no one ever seems to talk about it. A foreign submarine was discovered at the entrance to the harbor before the attack. A radar station picked up incoming aircraft before the attack.
And code-breakers were reading diplomatic messages of all kinds — you guessed it — before the attack.
Yet it came as a total surprise.
Imagine looking across the great Pacific with absolutely no idea as to what was waiting for you just over the horizon. Nothing? Something? An entire fleet?
Every day, millions of amateur futures traders stare intently at their chart having no idea what’s about to happen. Yet the signs of impending price action attacks surround them. These signs can be recognized in a second, simply by monitoring the harmonic patterns of Fibonacci.
Embedded within every reversal, trend or range — you’ll find the golden ratios of 23.6%, 38.2%, 50%, 61.8% and 76.4%. They surround us. These ratios can’t be denied because they are tied to the very universe we live in.
Still, they are ignored, overlooked, or worse yet — completely misunderstood.
It’s these price action patterns, where the market telegraphs exactly where to enter and where to exit, that hold the opportunities for profit. Everyone knows they’re out there… somewhere… just over the horizon.
Check out the below ES chart, for your typical run-of-the-mill Wednesday session. Nothing special about the price action. And on a 7-minute chart? Four solid trades with $4.6K on the table.
If you think there’s a chance on God’s green earth that these retracement and reversal entry opportunities somehow don’t have any correlation to the Fibonacci ratios… think again.

Simply take a step back and look at the same entry points with Fibonacci retracement added. The connection is more than uncanny. It’s math.

If you’re reading this and thinking… ‘I know about Fibonacci — I use it all the time’… you’re not alone. A simple Google search will reveal over 1.4 million results for ‘Trading Fibonacci Levels’.
So if we know these levels hold massive profit opportunity, why isn’t everyone bagging staggering profits trading them?
The answer is shockingly simple.
Chapter 2:
Why Hand-Drawn Levels Never Crack The Code
The hidden risk that’s unleashed every time you manually draw Fibonacci levels.
At the time it seemed like a good idea. Lining up all of the battleships in a concentrated formation while they were docked. Logistically it may have been easier during peacetime operations.
During a war with an invading force? It made the bulk of the U.S. Pacific fleet a sitting duck — with nowhere to go. This would be a painful, costly, deadly lesson that would take years to fully recover from.
Although at a different level — with far less at stake — imagine adding something to your chart that makes your account a sitting duck for price action.
That’s exactly what amateur traders are doing every time they manually draw Fibonacci ratios on their chart.
The moment you do this, even with the best of intentions, you are adding uncertainty and risk to your trading. To be clear, it has nothing to do with Fibonacci. The ratios work beautifully.
It’s just that there are two basic elements that a hand-drawn level will never be able to provide you in a futures market:
- Advance Notice of Price Action: By the time you’ve reached for the retracement tool and added the ratios to your chart — you’re already late.
- To-the-Tick Precision: Honestly, whoever really knows exactly where to put the starting and ending anchors? And the ratios that you end up with? Sure they look good — but should you trade them?
Here’s a perfect example in the ES. Sellers take control and drive price to the basement. A perfect place to see if you can enter on the fade. Just as you’ve been taught — you reach for your Fibonacci retracement and start clicking and dragging to size up the price levels.
Your single thought? ‘Let’s see exactly where I need to get in to ride this baby down.’
And then an instant later you’re faced with the age-old questions every futures day trader finds himself or herself wondering:
- Where do I plot the start of the retracement?
- Where within the 50% or 36% levels should I be entering?
- Is price ever going to retrace that much?
- Will I ever get confirmation?
- Where on earth should I target the exit?
- How long should I plan to stay in?
- How much room should I give my stops?

And so the second-guessing begins. And the doubt officially starts to creep in.
By the time you enter… you’re LATE. By the time you realize that you’re late… you’re LOSING. By the time you’ve lost… the market has moved on.
The money has been made and you are left holding the bag… wondering if it was you… the golden ratios of Fibonacci… or everything, that let you down.
Here’s another infamous Fibonacci debacle… the extension.
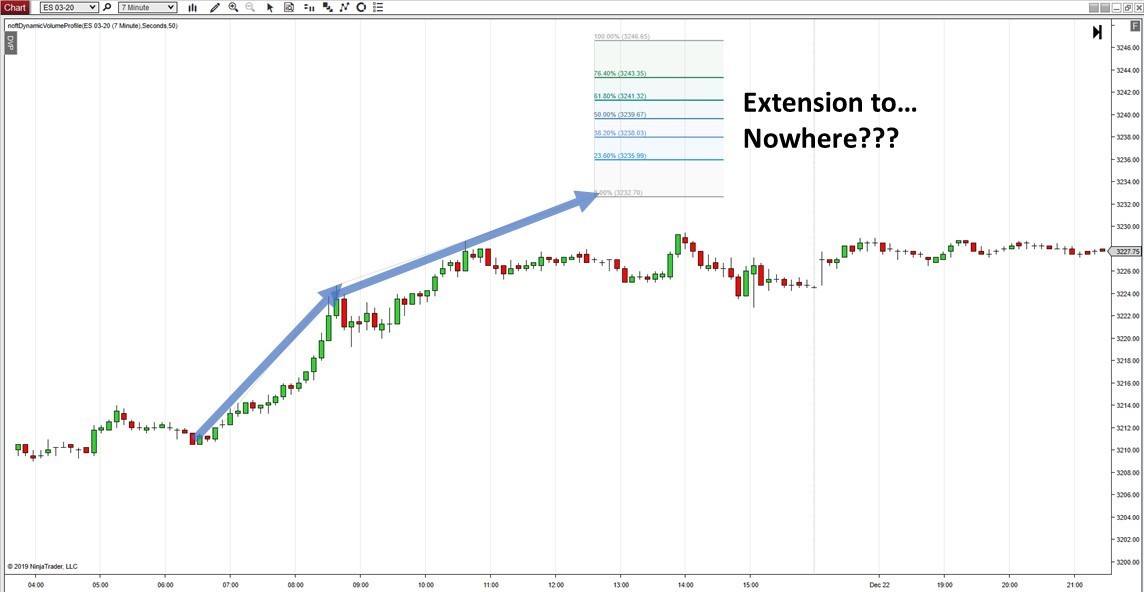
Price goes on a run in either direction and you logically decide to project the future extension points for the continuation. Yet, as you sit and wait for price to continue on its meteoric run… nothing happens.
In fact, price fizzles. And there you are, left wondering, holding and losing. Worse yet, you’ve exposed precious capital to massive amounts of risk.
All without any real idea of what price might do or where it will go next.
Is it you? Is it Fibonacci? Neither actually.
It’s the dynamic nature of the futures market you’re day trading. There’s simply no way you can tune into great harmonic pattern trading strategy by trying to eyeball price action — no matter how fast you click, drag and draw.
Adding oscillators or other indicators won’t help either.
Here’s the deal: You can crack the code of Fibonacci and the price action profits that come with these ratios in one step. And it’s way easier than you would think.
It starts by adding the missing element 99% of traders simply don’t have when trading Fibonacci-based price action.
Chapter 3:
Two Vital Weapons For Any Fibonacci Trade
Transforming your view of Fibonacci price action in one step.
The Japanese fleet that sailed on Pearl Harbor was nothing if not massive. All in, there were more than 50 ships, including six aircraft carriers and two enormous battleships. Four hundred and fourteen planes were brought — and 350 of them took part in the raid.
Talk about an armada. When trading Fibonacci reversals and retracements, you don’t need a lot. Across every futures market, in any time frame — you can generate consistent profits using only nine basic Fibonacci-based patterns.
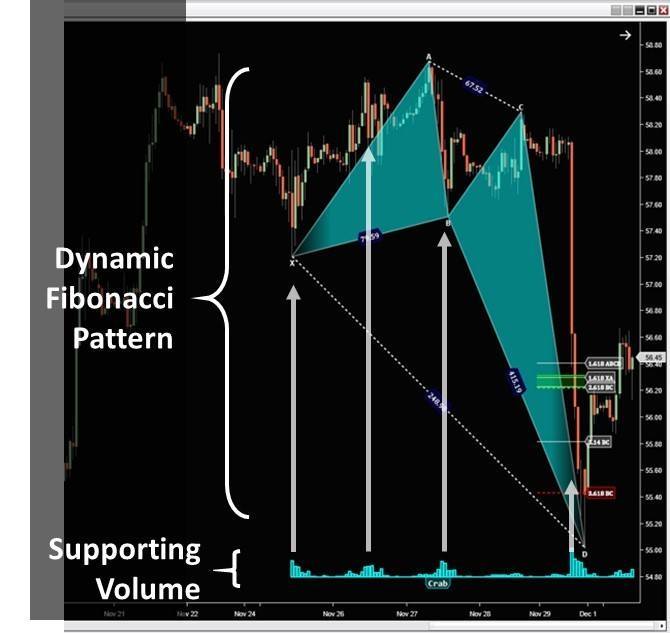
Make no mistake however. These are not patterns that you’ll find by clicking and dragging. Nope. This is dynamic, harmonic pattern trading strategy driven by the very fuel that drives any market’s intra-session price action — volume.
Without volume, it’s impossible to see exactly what type of price action is unfolding. This is the differentiating element that provides advance notice and allows you to crack the Fibonacci reversal and retracement code.
If you somehow think that price magically arrives at a Fibonacci level and then responds to the call of nature — think again. It’s volume that’s driving that action.
Note the dynamic pattern that’s been spotted in the above CL chart. Is it any coincidence that each of the critical pivot points in the pattern are driven by supporting volume?
Never. In fact, you can take it to the bank that every trade you want to make is driven by volume. And not just any volume. There is the current force of volume that’s driving price as buyers and sellers duke it out. Equally important, there is the volume that has preceded that price action that informs the direction the market will take.
You simply cannot begin to decode Fibonacci without the vital element of volume. Especially if you’re day trading futures.
It not only informs the harmonic pattern trading strategy, but it provides the advance notice you need to enter early enough for consistently profitable trades.
And the patterns? These aren’t your dad’s old Fibonacci patterns.
This revolutionary harmonic pattern trading strategy translates the Fibonacci retracement and reversal levels into high-probability trades in any market.
There are nine core patterns that reveal high probability entry and exit trades — all based on the Fibonacci reversal and retracement ratios.

It’s critical to note that these patterns, just like any other price action pattern strategy, requires confirmation. You need to be able to avoid the fake-outs and the false starts that can be caused by any number of market factors.
This is why you need to take the guesswork out of your Fibonacci trading and have the patterns detected and drawn for you.
This way you can concentrate simply on picking your entries and making your trades. Just like the institutional traders, you need to automate the process.
Chapter 4:
Going On The Offensive With Confidence
How to automate your entries and manage your trades without doubt.
On June 1st 1939, the Japanese introduced what would now be known as JN-25 — their new cypher system. It would ultimately grow to include over 33,000 words, phrases and letters — and become the primary code during the war.
After Pearl Harbor, cracking this code became a life-or-death priority for the U.S. military. Seven hundred thirty-eight dedicated men and women would spend their waking hours trying to crack this code. In the meantime, every battle, every troop movement and every message held the potential for disastrous outcomes.
Unbeknownst to the Japanese, they did it right away.
You don’t need a team of people to crack the code on Fibonacci profits.
It has already been done for you. In fact, you can automatically identify dozens of harmonic patterns in each session with one simple addition to your chart. Talk about harmonic pattern trading strategy!
This means that you can forget having to ever hand-draw a pattern hoping for a reversal or retracement — only to show up late, or not at all. In an instant you can eliminate the second-guessing, the low- or no-profit trades, and the doubt on when to enter and exit.
Imagine a system that sorts through millions of price action permutations and captures the highest probability retracements and reversals for you.
Welcome to Harmonic Pattern Pro.
A fully automated system that simultaneously organizes and prioritizes high probability Fibonacci entries and exits for you. This is the only Harmonic Pattern recognition system that has been built specifically for futures day trading.
Unlike other systems that use the same cookie-cutter approach to pattern recognition across stocks, currency pairs and other instruments — Harmonic Pattern Pro is based on the dynamic volume that drives futures price action.
And it’s not just a red light, green light tool. It’s an entire system that gives you a complete step-by-step process to reading the patterns, managing the trades and harvesting your profits.
The secret formula for futures day trading brings together pattern recognition with volume confirmation. Validation signals are provided and powerful chart templates are supplied.
This is important because there are dozens of high probability profit opportunities that will be surfaced for you — every trading session.
Manually clicking, dragging and guessing with Fibonacci retracement and reversal patterns can be a thing of the past. Trying to crack the code on entries and exits can be left to the millions of other amateur traders that toil away for hours hoping to break even.
Conquer the invading force of Fibonacci price action forever. Boost your harmonic pattern trading strategy. Start profiting every session with your pick of dozens of confirmed harmonic patterns.
Build an account that is nothing short of victorious.
Your Next Best Steps:
Step 1:
Step 2: